August 7, 2025
Sterndesk built a matrix tool to visualize candidate experience clearly and intuitively
At Sterndesk, we’re not just building digital tools, we're shaping workflows that power the maritime industry. As a product designer, my role is to translate complex operational needs into intuitive, efficient interfaces that recruiters and crew managers actually enjoy using. One recent feature we designed is a great example of how our UX/UI process works and why thoughtful design matters.

We’re fortunate to work closely with a core group of regular users. Their feedback doesn’t just influence our roadmap, it is our roadmap. A recent request from recruiters was clear: “We need a better way to visualize a candidate’s experience across vessel types and ranks.” It was a great opportunity to create something that delivered insight at a glance.
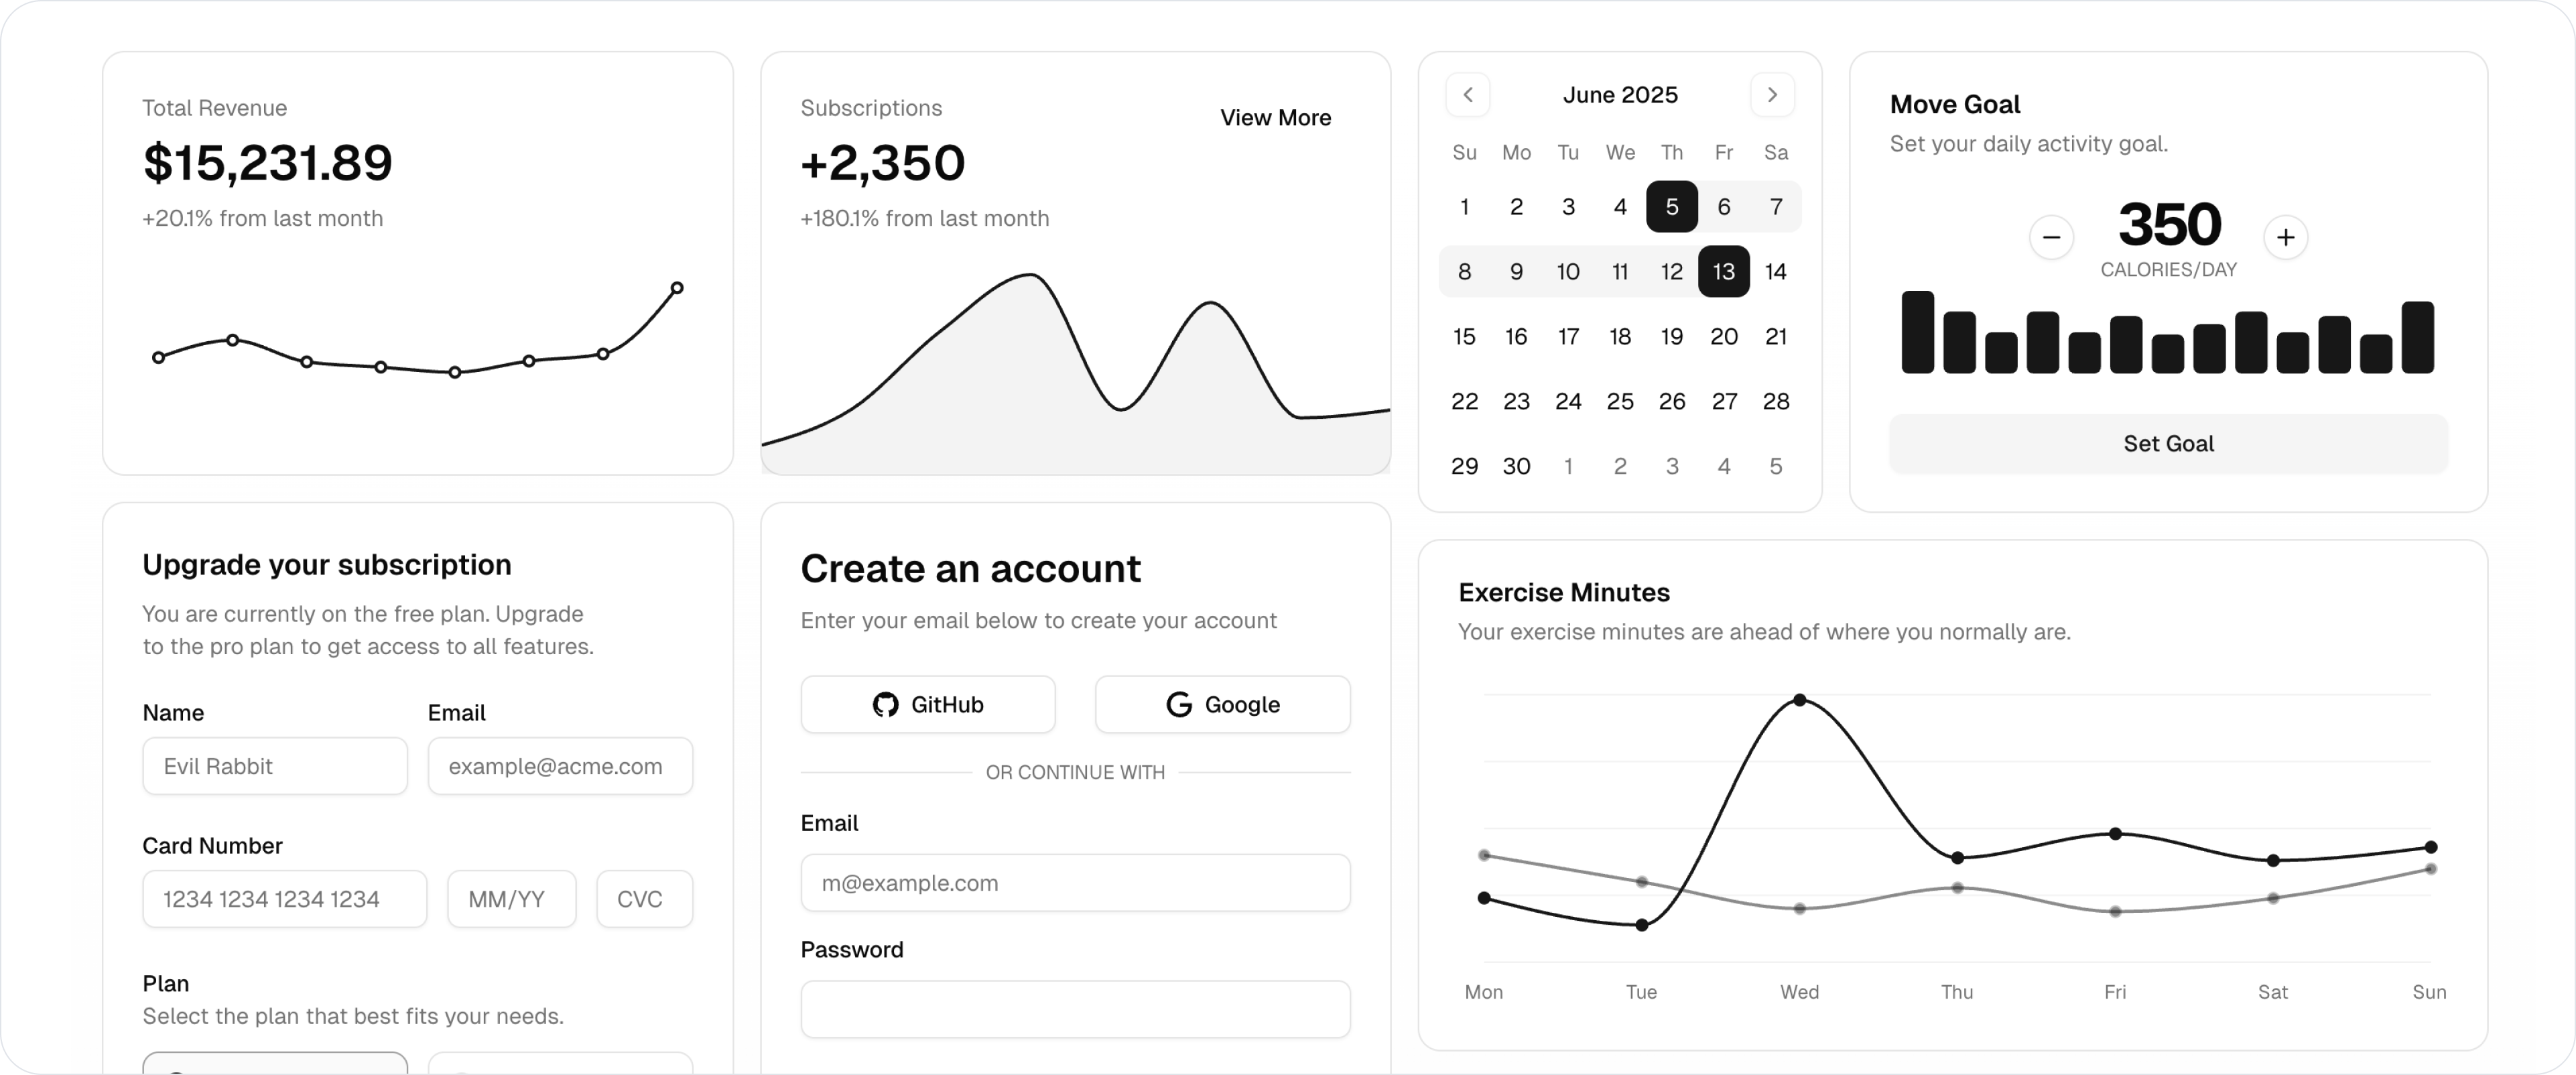
I began, as usual, with research and inspiration. Using Figma as my primary design platform, I collected screenshots of similar visualizations from competitor platforms and other industries, heat maps, pivot tables, even fitness trackers. This stage is where ideas are free to form without the constraints of the final product.
I mocked up a few initial wireframes. We explored several data visualization options like bar charts and pie graphs, but ultimately realized they were too abstract for our users. Recruiters needed something more literal, more tabular. The solution? A matrix table.
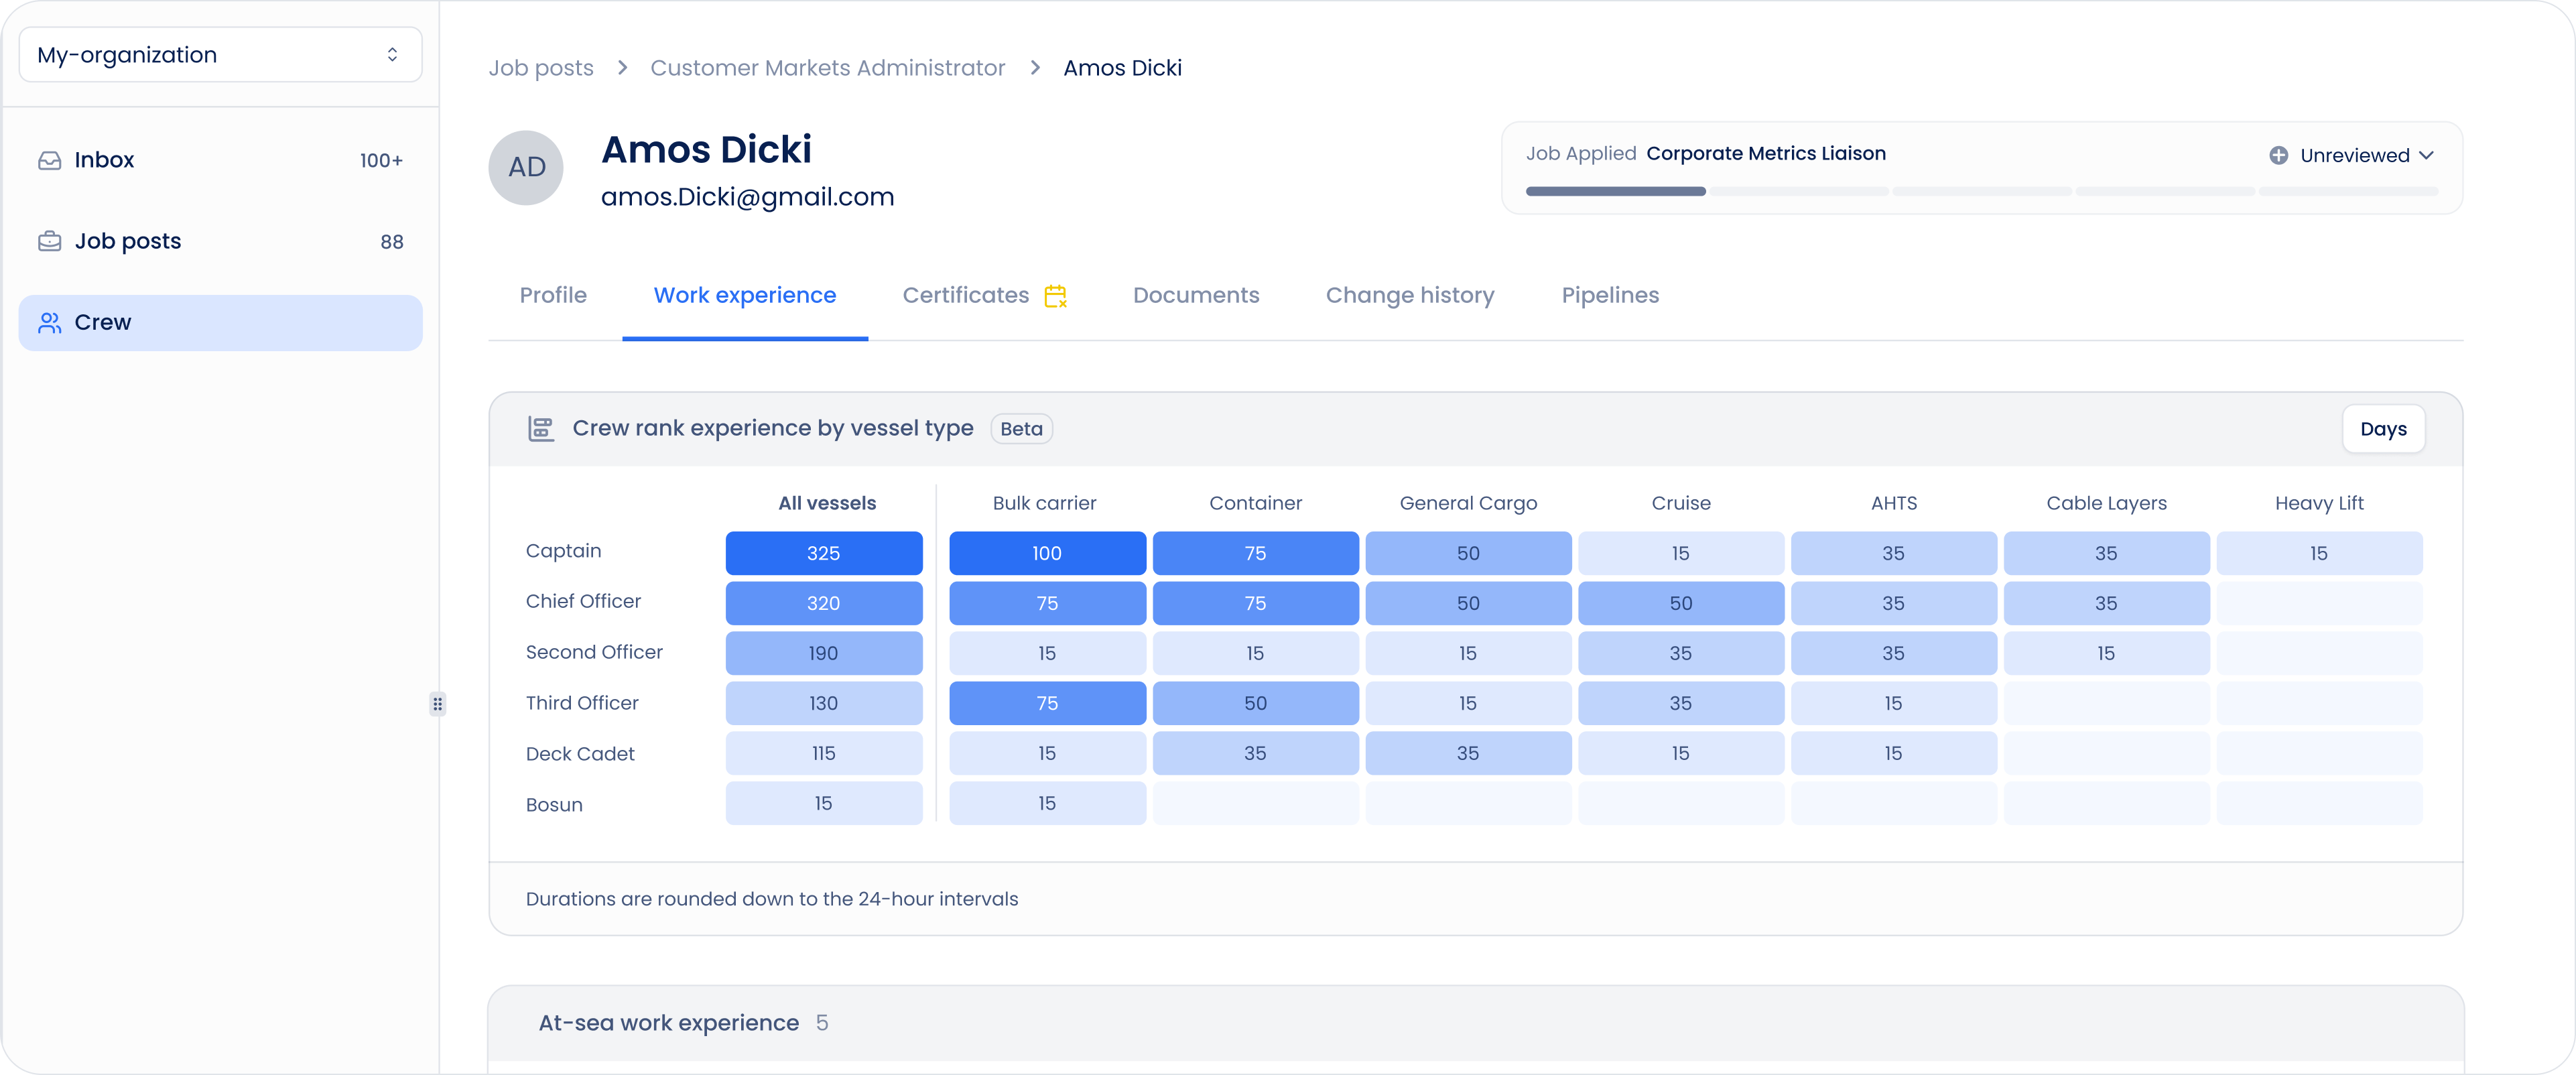
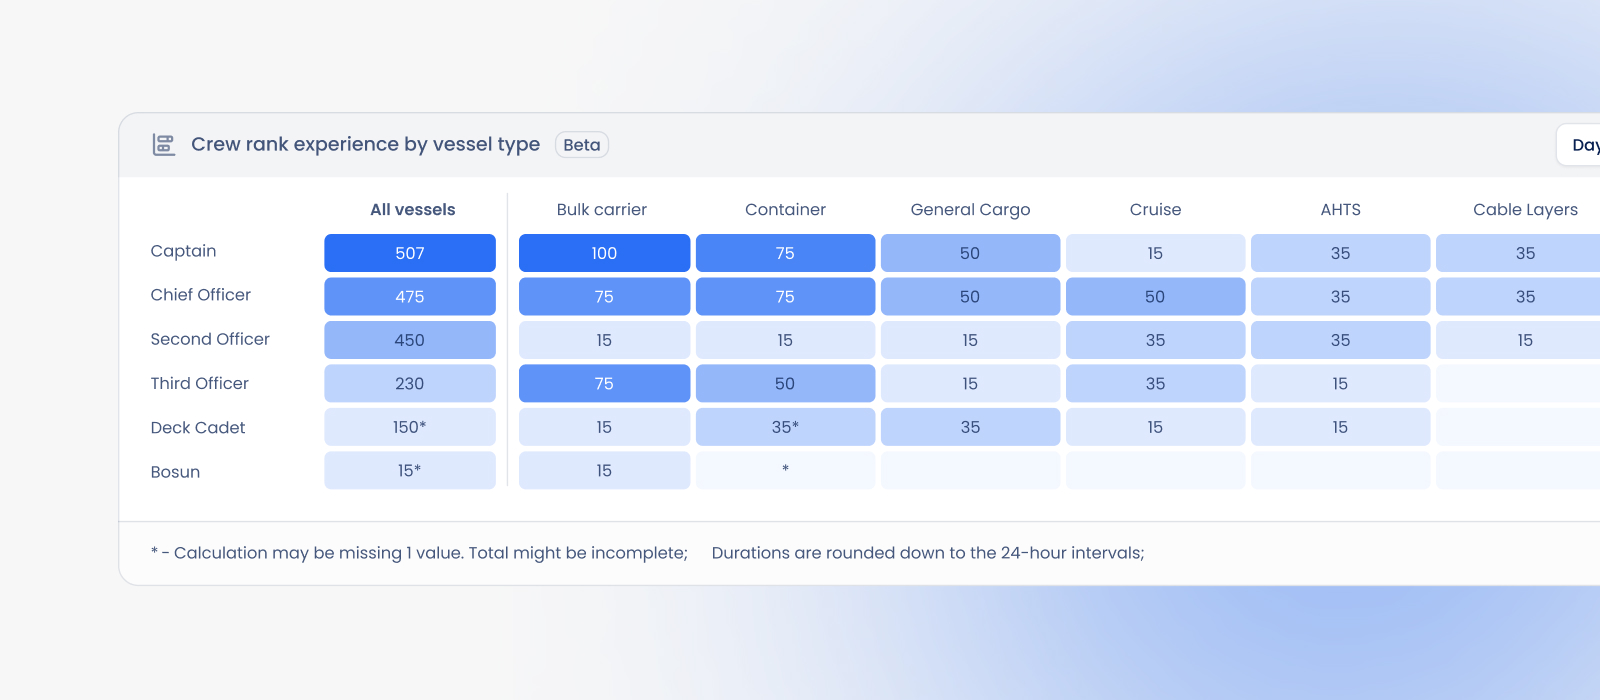
We repurposed our existing table component to maintain visual consistency across the app (and streamline development). On the X-axis, we placed vessel types; on the Y-axis, ranks. The cells show the number of days the candidate worked in each position-vessel combo.
To guide the recruiter’s eye, we added a color gradient: the higher the number of days, the more saturated the cell. This immediately highlights where the candidate has spent most of their time at sea.
This wasn’t just data design, it was decision design. Recruiters could now understand a candidate’s fit in seconds.
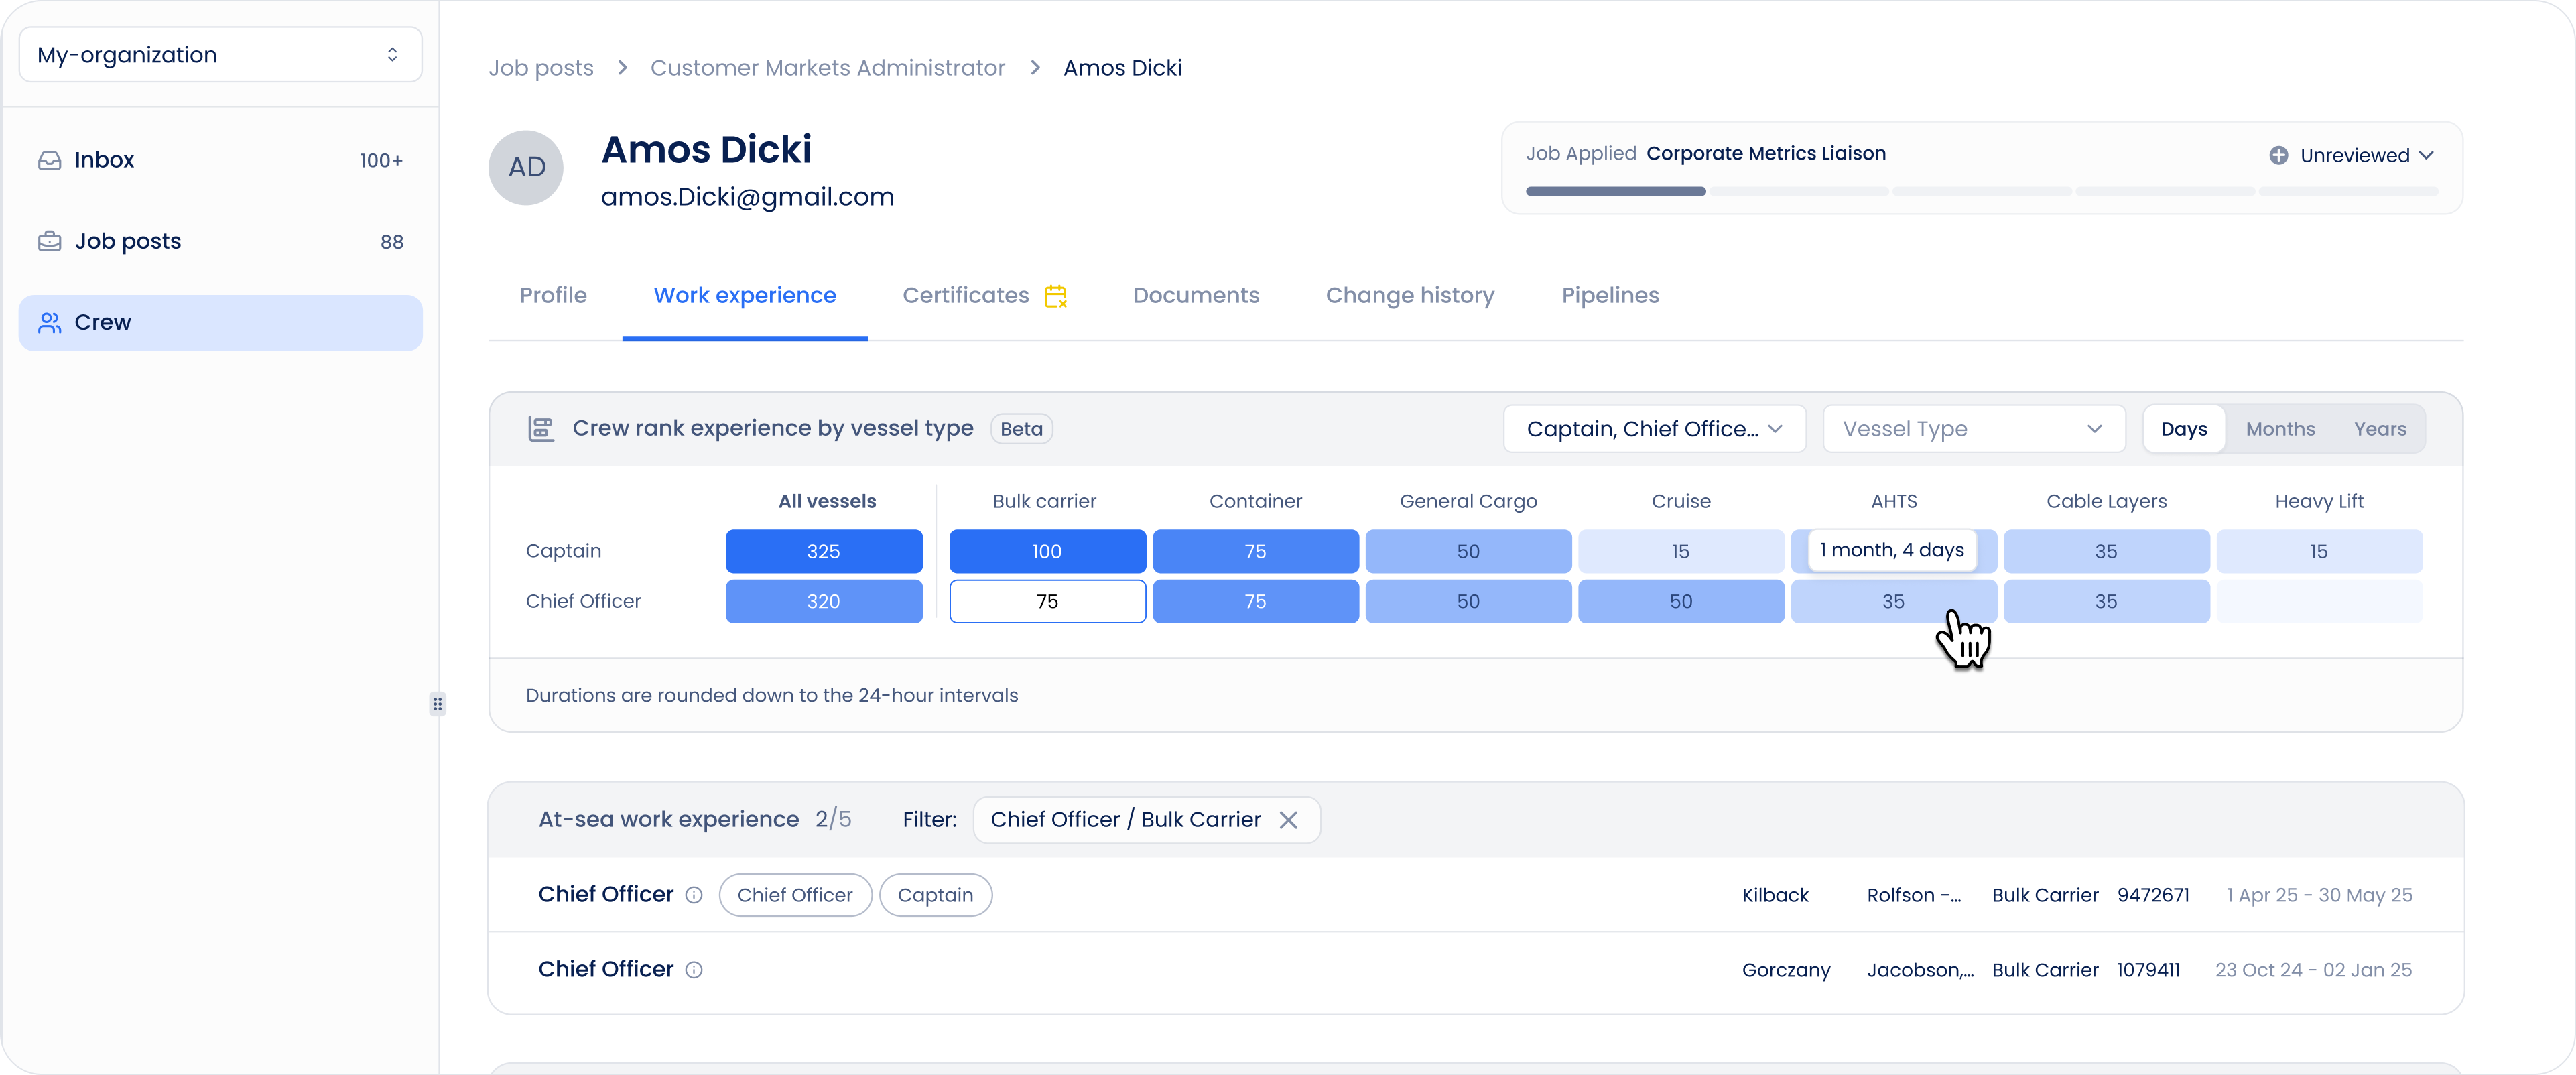
Once we had a working MVP, we didn’t stop there. While developers built the basic version, we ideated enhancements:
These additions don’t just “look nice.” They make the tool smarter, more useful, and ultimately indispensable for our users.
Design at Sterndesk isn’t just about aesthetics, it’s about making complex systems feel simple. Good UX reduces friction. It transforms confusion into confidence. And it ensures that a recruiter, perhaps reviewing dozens of candidates a day, doesn’t waste time guessing what a chart means.
Great design also builds trust. When users see consistency across the platform, from colors to component behavior, they intuitively understand how to navigate, where to click, and what to expect.
Design is about meeting the exact needs of the user, clearly and efficiently. That’s exactly what we strive for in every feature we build.